Adjusting the Graphs
Vertical Axes
The 'top end' (maximum value) and the 'bottom end' (minimum value) of the vertical axes of each graph will adjust automatically to accomodate the data.This is generally satisfactory but you may like to adjust the minimum and maximum values on the axis 'manually' for a number of reasons:
- In order to get a closer "view" of the graphs - especially if the values are very large.
- To separate the upstream and downstream plots if their values are similar and overlapping.
- To more accurately align the left or right scale with the horizontal grid lines.
- The value is outside the graph's minimum or maximum value and the graph hasn't adjusted (for some reason).
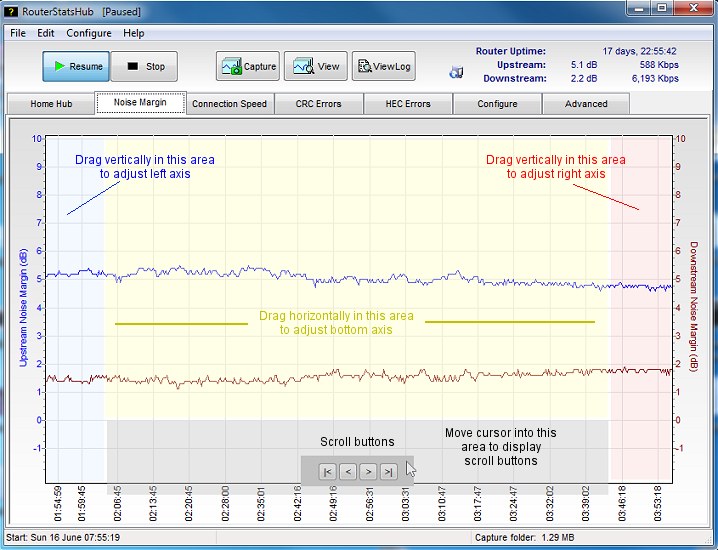
The axes are adjusted by holding down the left mouse button and dragging the graph either upwards or downwards.
The left axis will be adjusted if the mouse is anywhere on the graph near the left axis and the right axis will be adjusted if the mouse is near the right axis.
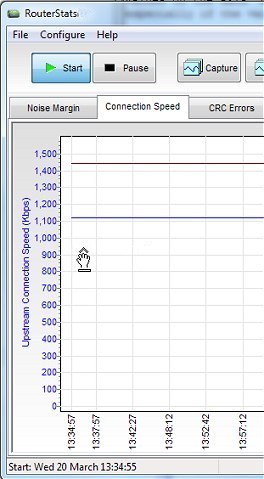
When dragging, the axis minimum value will be fixed (left picture). This allows the axis to be expanded or 'compressed'. The cursor shows as a "drag hand" with an upwards-pointing arrow and a bar underneath.
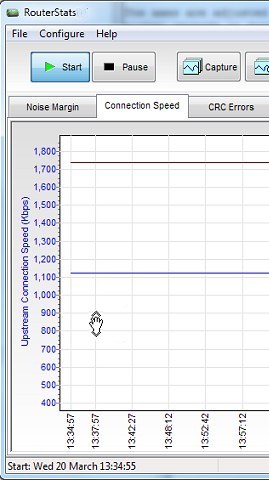
Sometimes, it's more useful to adjust the axis minimum as well. In order to "shift" the entire graph scale (ie move both minimum and maximum values), hold down the Shift key while dragging with the left mouse button. Notice the cursor now shows a down-pointing arrow as well (right picture) and the entire scale "scrolls" up or down.
Using a combination of dragging with and without the Shift key the axis can be adjusted to any range of values. However, only the Noise Margin graph minimum will adjust below zero as it doesn't make sense for the other graphs to have negative values.
Horizontal Axis
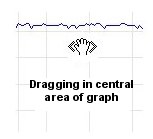
The horizontal axis will scroll automatically as more points are plotted. Older points will scroll off to the left of the graph but the graph can be dragged horizontally to look at these points at a later time.Note that, when RouterStatsHub takes the next sample, the horizontal axis will automatically return to the present time... if you want to look at the historical data for an interval longer than the sampling interval, it's more convenient to press the main Pause button until you're ready to resume.
The cursor with the left mouse button down will sprout a pair of left and right pointing arrows but note that the graphs cannot be dragged horizontally until at least one full 'page' has been plotted.